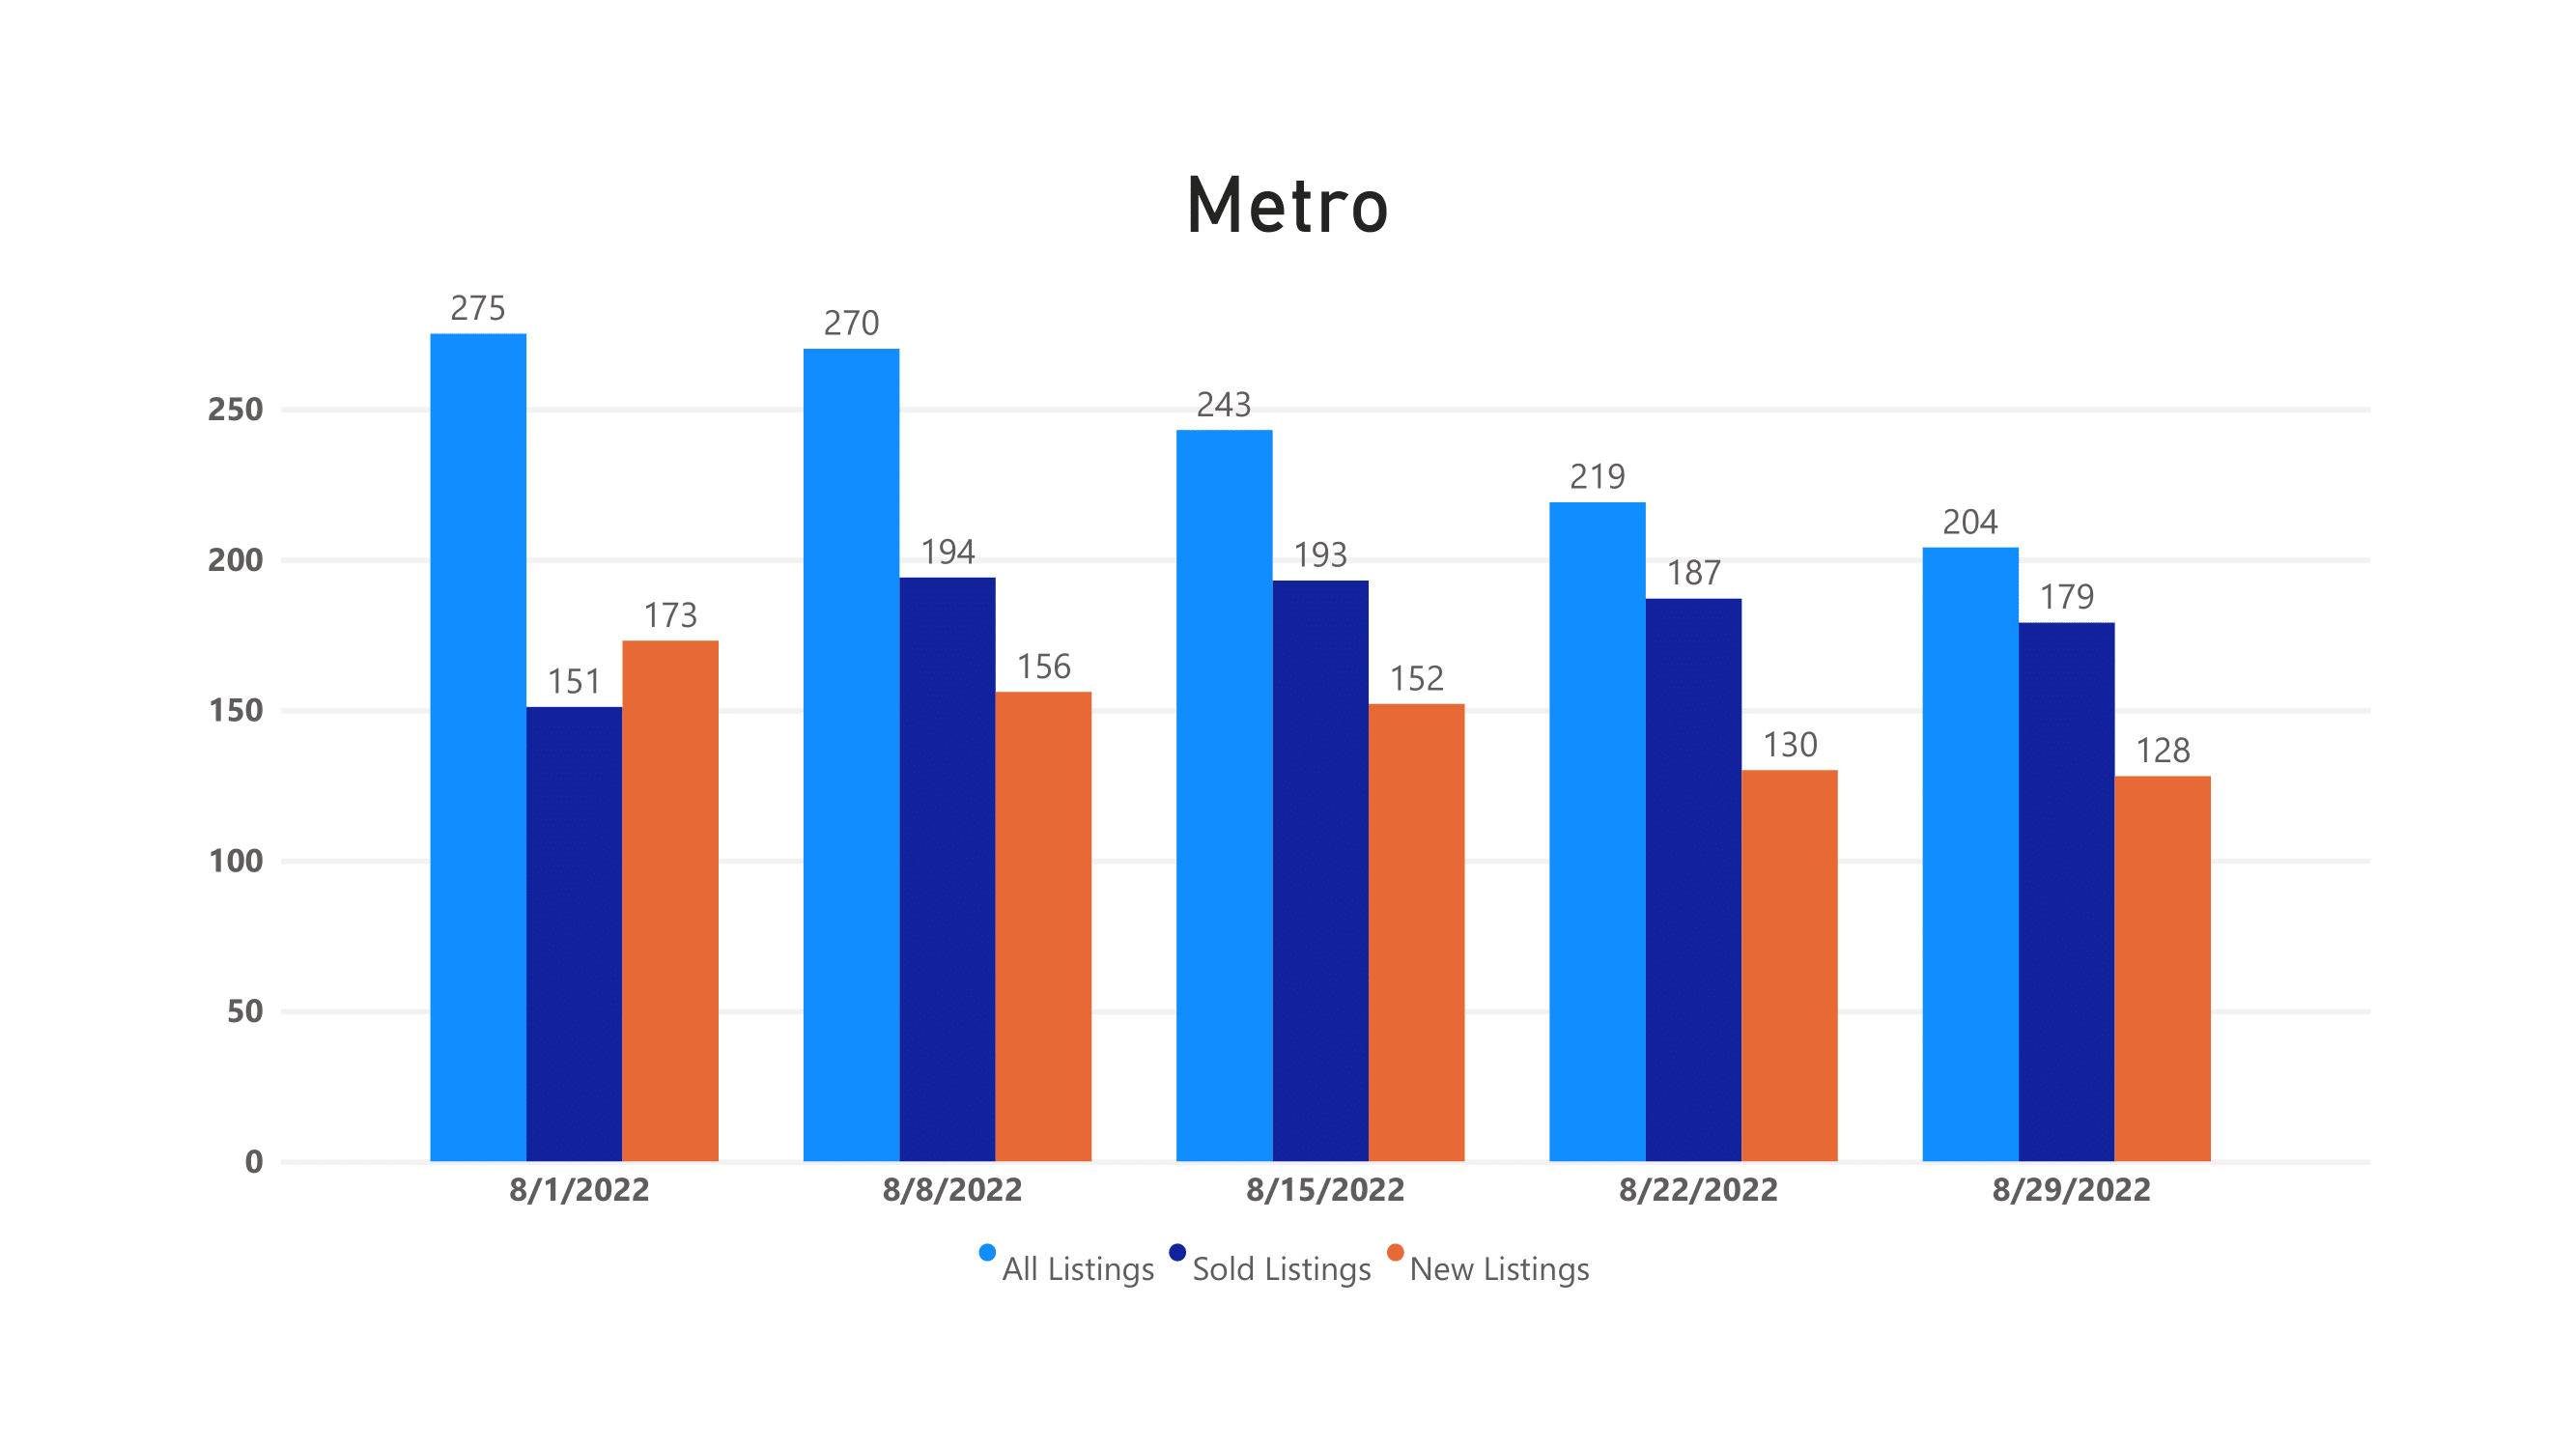
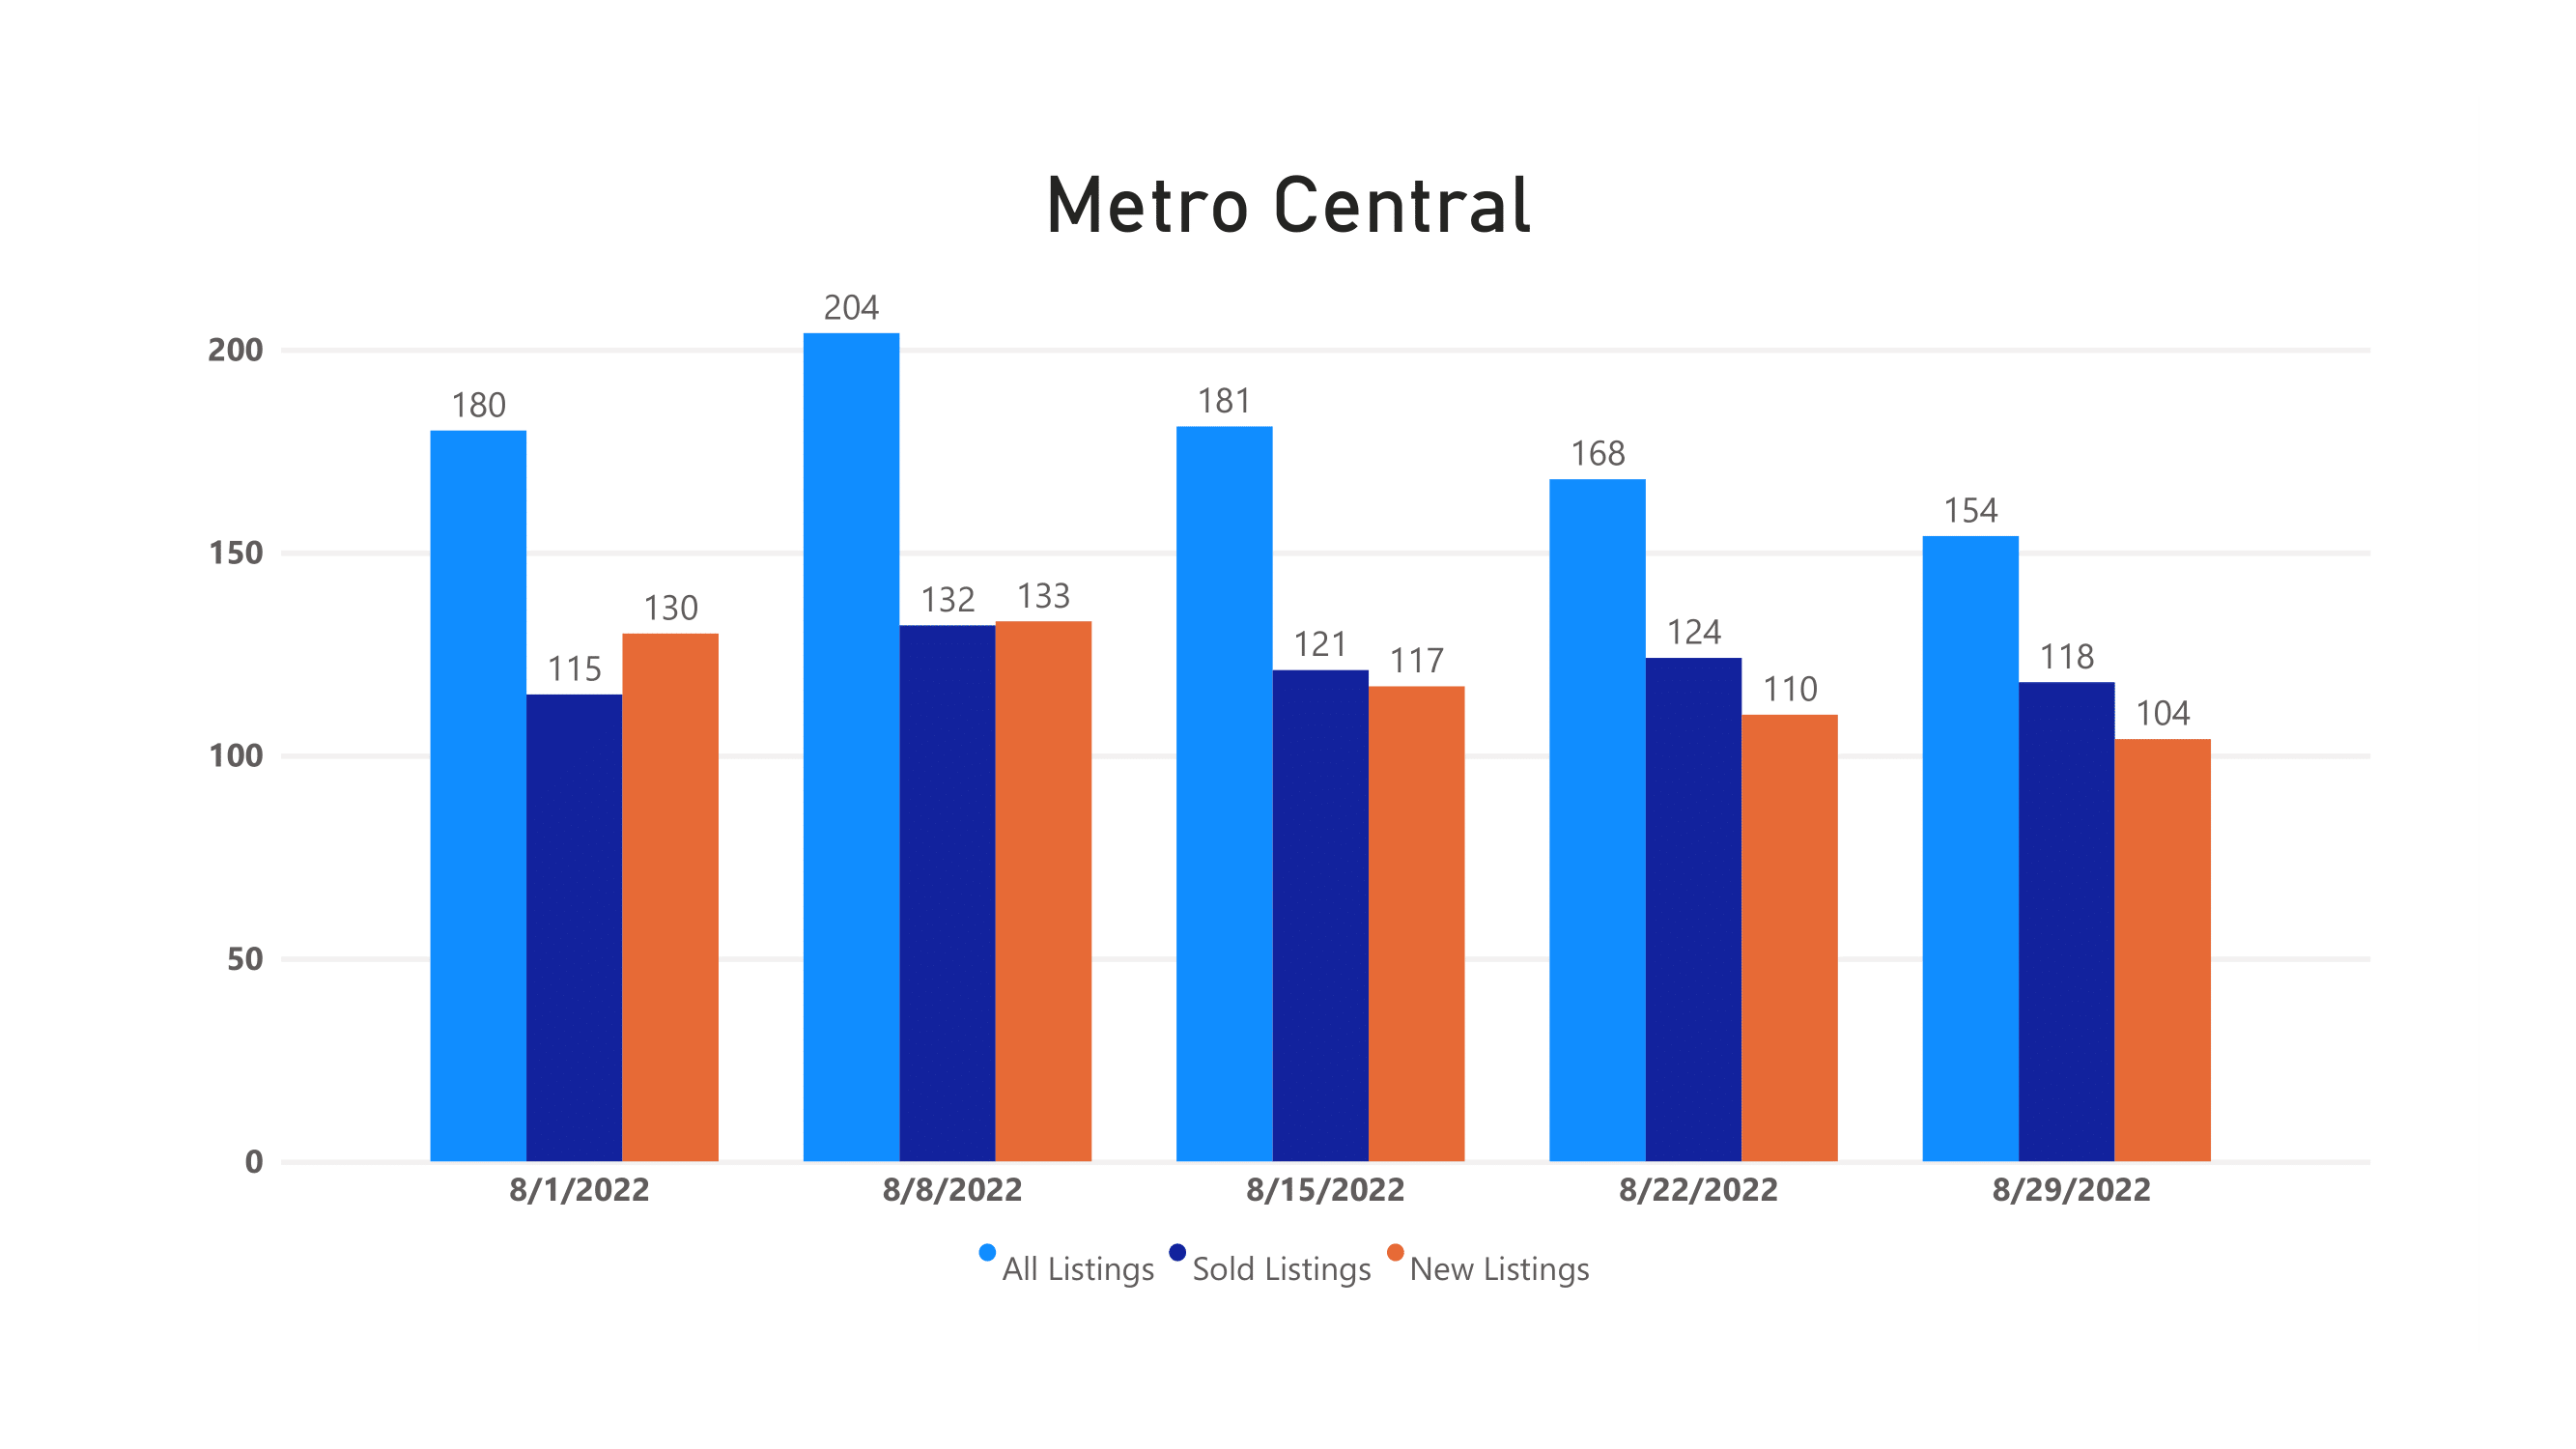
The San Diego Multiple Listing Service is happy to bring you our local housing market statistics wrap-up for each month. Each graph below shows all new and sold listings for seven days and thirty days in each area. These statistics are made available for you to spot trends in the housing market and provide relevant data to your clients, allowing you to make educated decisions in the home buying and selling process.
We are dedicated to your success and strive to provide you with the best local resources and programs to serve your clients. If you would like to receive these statistics via text, click the Update Statistics Preferences link below and add the areas you would like to include moving forward.
Thank you for subscribing to the San Diego MLS local area stats program.
Best wishes,
San Diego MLS